Bloomberg Innovation Index 2021
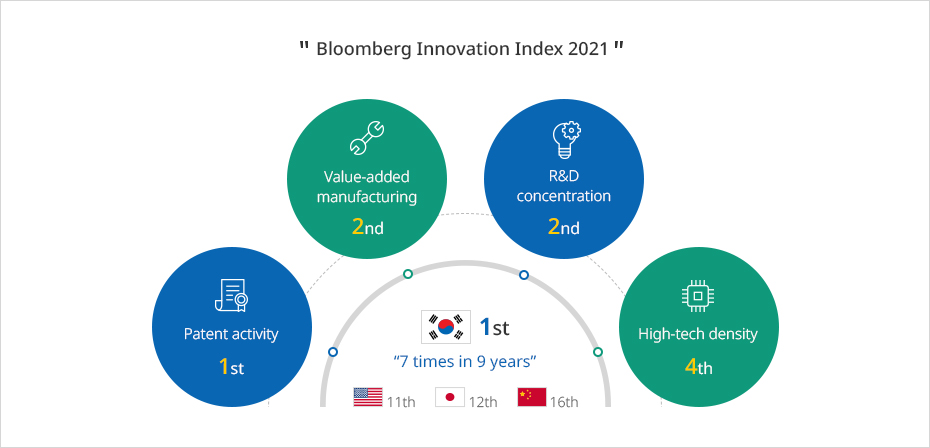
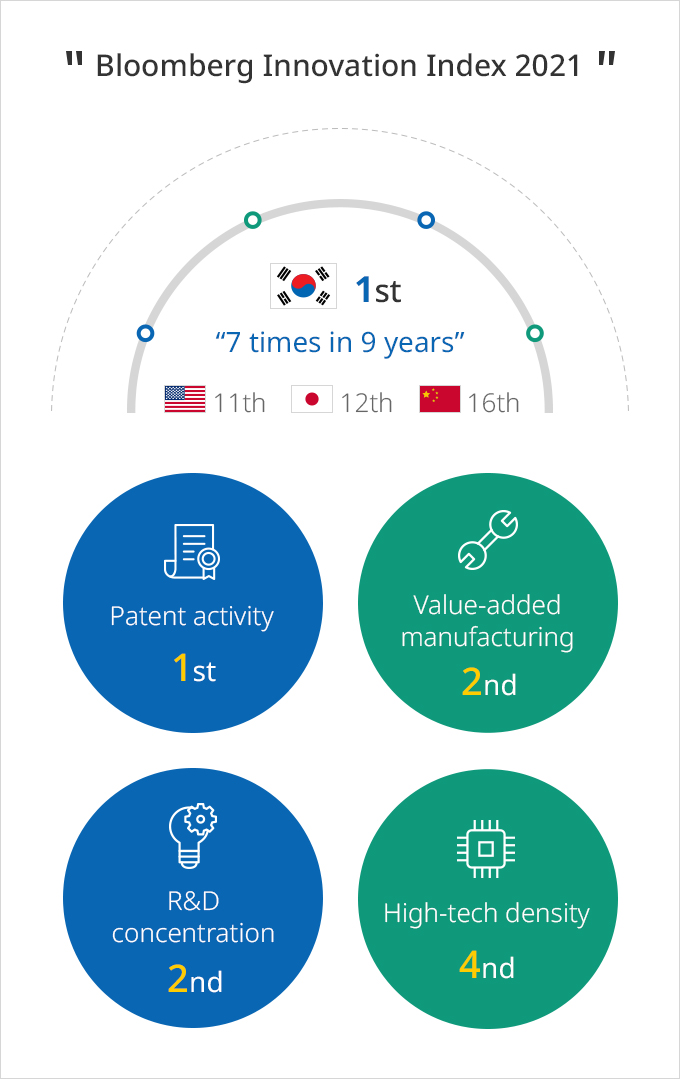
Bloomberg Innovation Index 2021 1st - “7 times in 9 years” (US 11th, Japan 12th, China 16th)
- Patent activity - 1st
- Value-added manufacturing - 2nd
- R&D concentration - 2nd
- High-tech density 4th
※ Source : Bloomberg (Jan. 2021)
Ranked 6th in 2022 Global Innovation Index
According to the World Intellectual Property Organization (WIPO), Korea ranked 6th
in the Global Innovation Index to be evaluated as the best innovator in Asia for the second consecutive
year. Korea topped the world in seven categories of patent application per GDP, PCT (international
patent application) per GDP, industrial design application per GDP, researchers per population, research
talent in businesses, government online service, and e-participation.
Global Innovation Index 2022
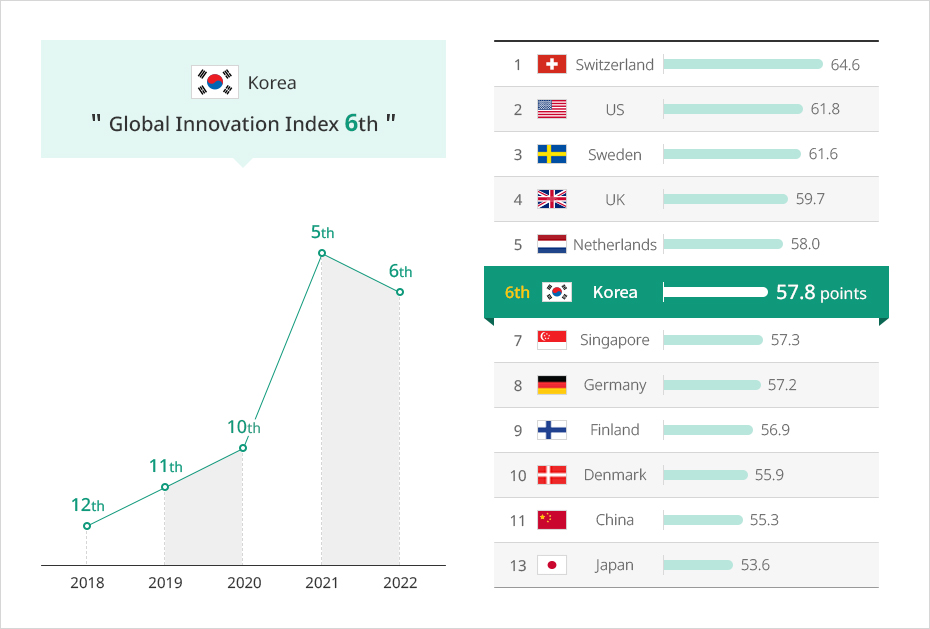
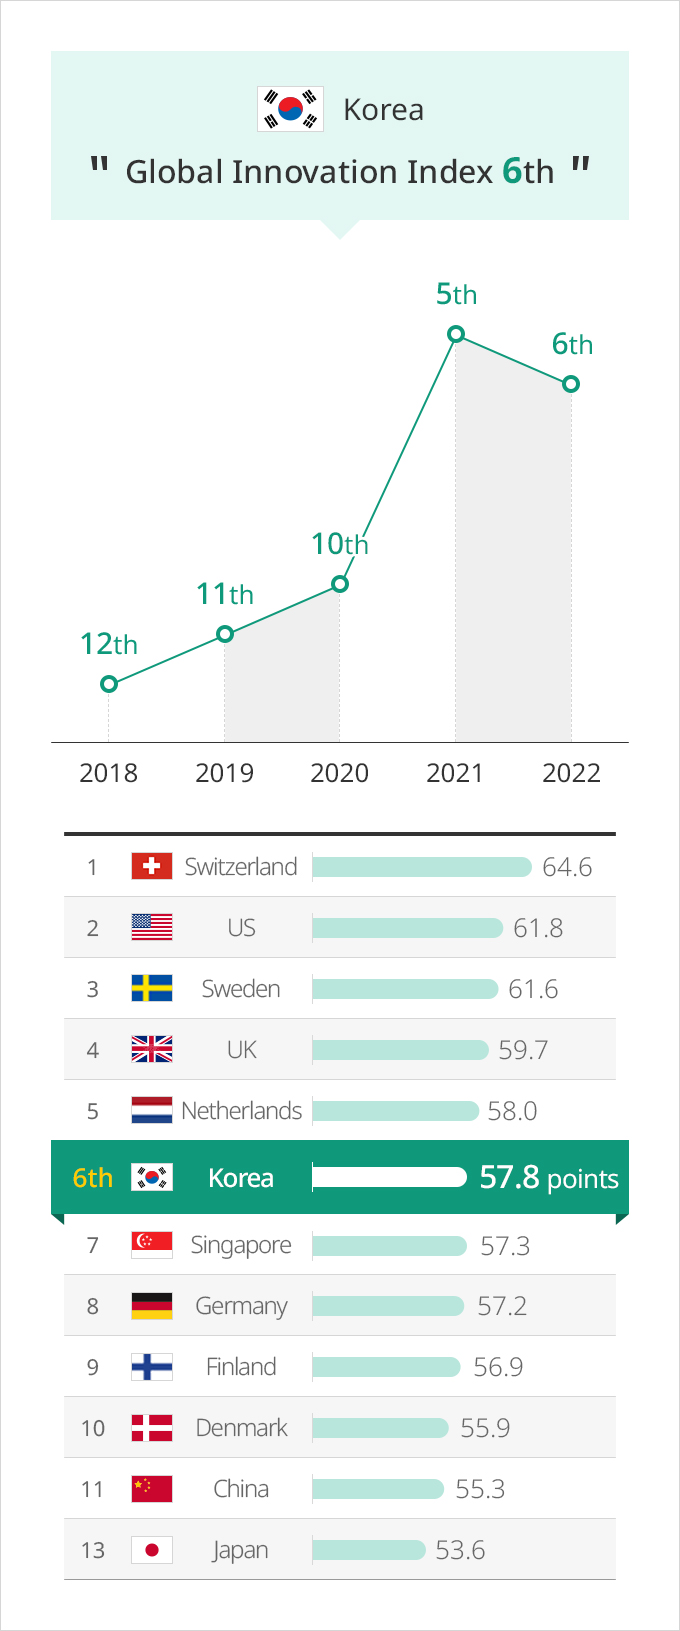
Korea Global Innovation Index 6th
- 2018 - 12th
- 2019 - 11th
- 2020 - 10th
- 2021 - 5th
- 2022 - 6th
- 1st Switzerland - 64.6
- 2nd US - 61.8
- 3rd Sweden - 61.6
- 4th UK - 59.7
- 5th Netherlands - 58.0
- 6th Korea - 57.8
- 7th Singapore - 57.3
- 8th Germany - 57.2
- 9th Finland - 56.9
- 10th Denmark - 55.9
- 11th China - 55.3
- 13th Japan - 53.6
※ Source : World Intelectual Property Organization (WIPO) “Global
Innovation Index (2022)"
Active Application for Intellectual Property Rights
As of 2021, Korea applied for 240,000 intellectual property rights, which is the
fourth largest in the world, following China, the US, and Japan. In addition, Korea ranked top in
resident patent applications filed per GDP of USD 100 billion, which demonstrates the nation’s strong
drive for technological innovation.
Resident Patent Applications per Unit of USD 100 bn GDP for Top 6 Origins (2021)
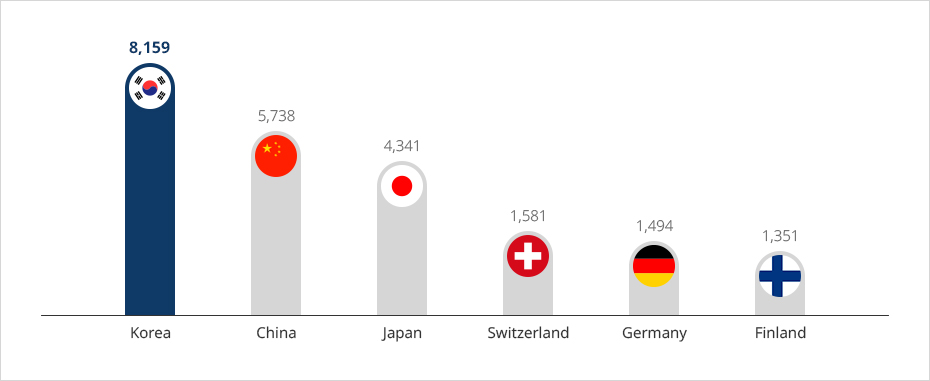
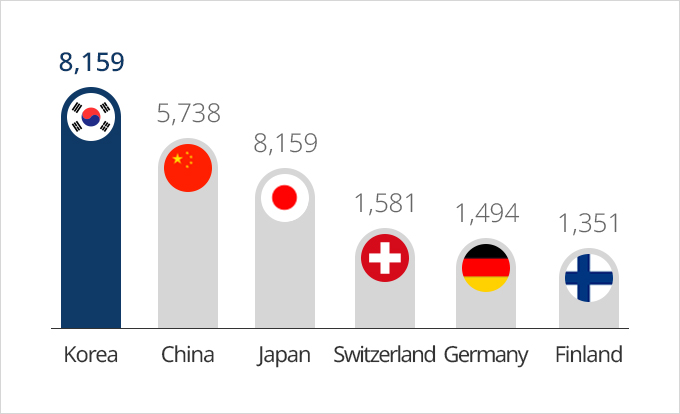
- Korea - 8,159
- China - 5,738
- Japan - 4,341
- Switzerland - 1,581
- Germany - 1,494
- Finland - 1,351
※ Source : WIPO (2022) “World Intellectual Property Indicators 2022”
The Number of Patent Application in Major Economies (2021)
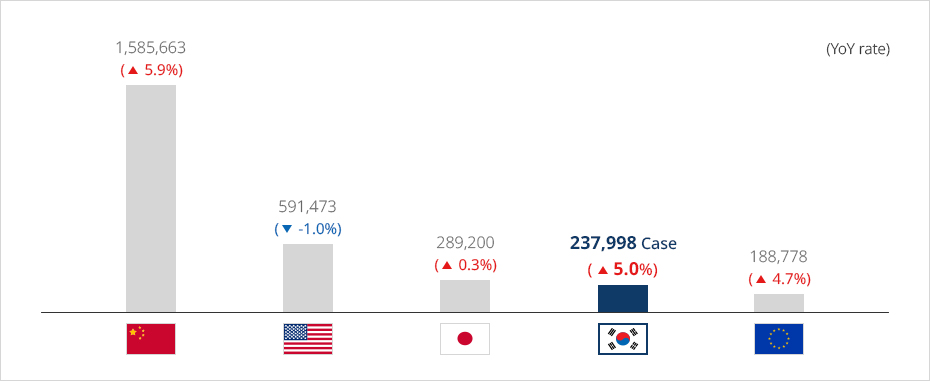
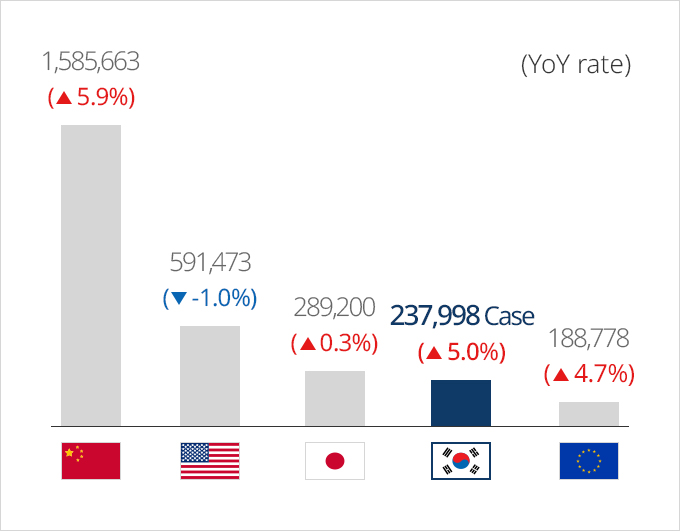
- China - 1.585,663 (5.9%)
- US - 591,473 (-1.0%)
- Japan - 289,200 (0.3%)
- Korea - 237,998 건 (5.9%)
- 유럽 - 188,778 (4.7%)
※ Source : WIPO Statistics Database (Feb. 2023)
Top 3 Patent Applications by Technology Sector in Korea (2021)
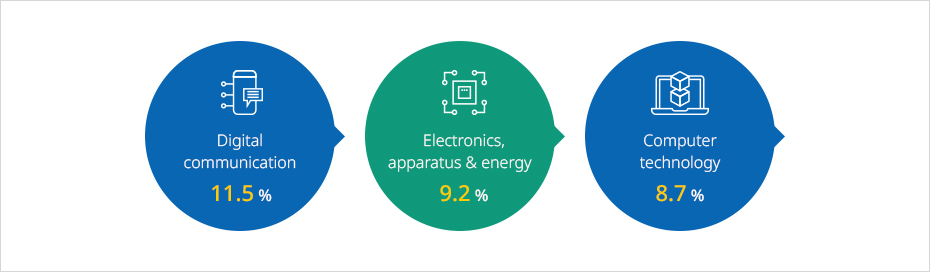
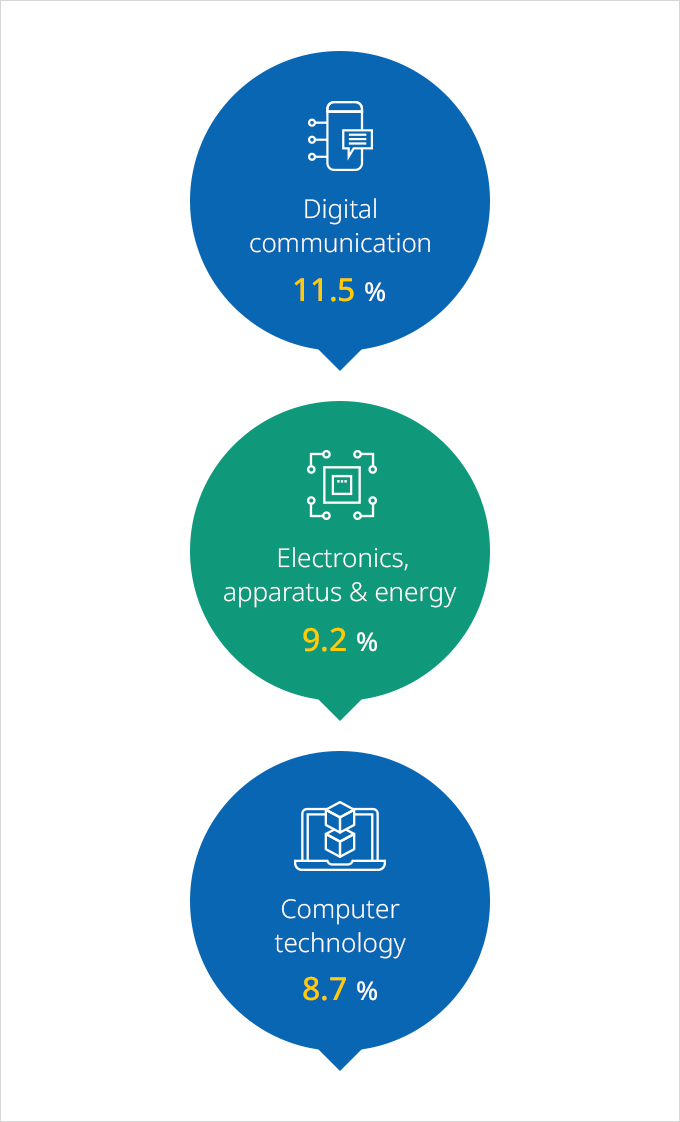
- Digital communication 11.5%
- Electronics, apparatus & energy 9.2%
- Computer technology 8.7%
※ Computer technology
R&D Investment
In 2021, Korea’s R&D investments surpassed KRW 100 trillion for the first
time,
and its R&D investment-to-GDP ratio stood at 4.96% to maintain the second place in the world after
Israel. With 16.7 researchers per 1,000 economically active persons and 9.1 researchers per 1,000
persons, Korea topped the world in the two categories.
Number of Researchers per 1,000 Persons Employed (2021)
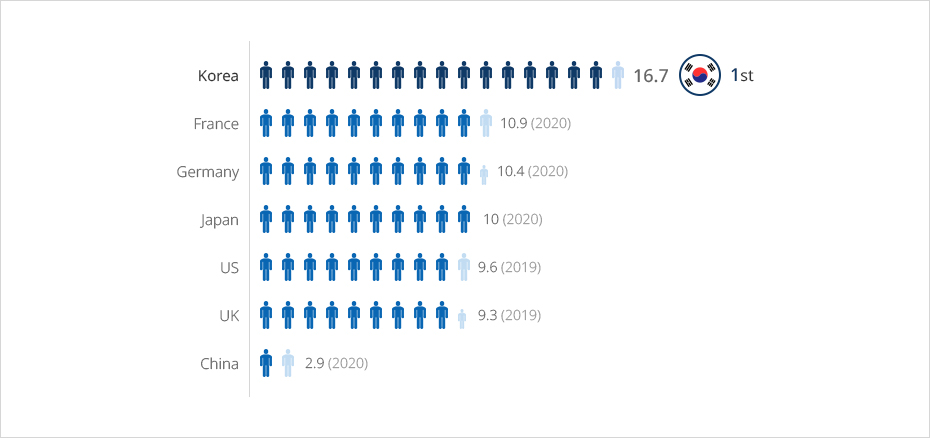
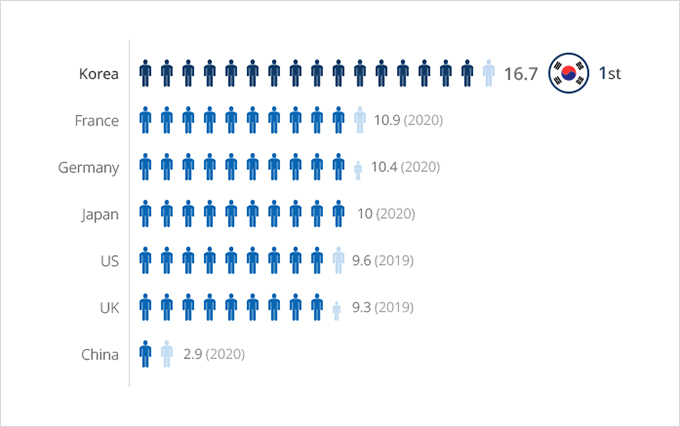
- 1위 Korea - 16.7
- France - 10.9(2020)
- Germany - 10.4(2020)
- Japan - 10(2020)
- US - 9.6(2019)
- UK - 9.3(2019)
- China - 2.9(2020)
※ Source : OECD (2022)
High-quality Workforce with the DNA of Innovation
Supporting Korea’s rapid economic growth in the last half-century are
characteristics prominent in the country, such as earnestness, responsibility, and flexibility. Korea’s
youth higher education completion rate was the highest among OECD member countries at 69% in 2021.
People are the most important resource in Korea, and they are what keep innovation alive in the country.
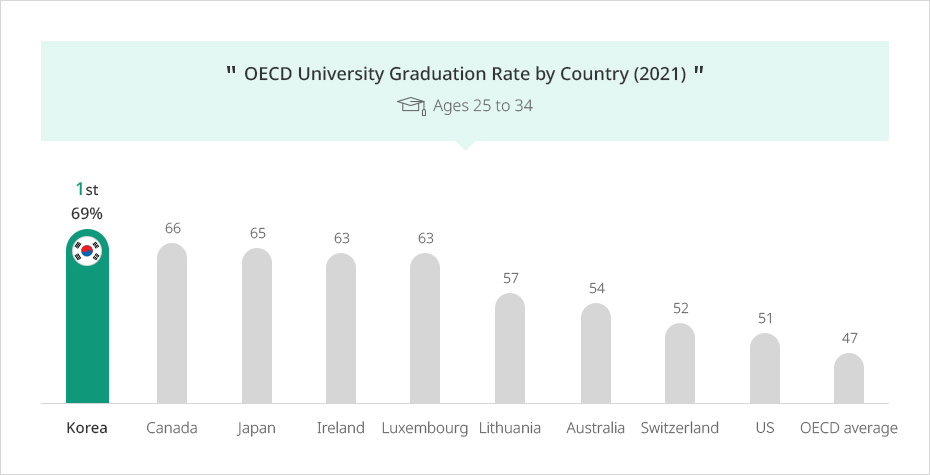
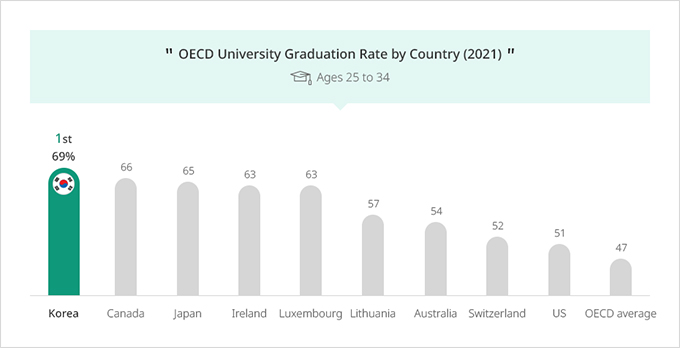
OECD University Graduation Rate by Country (2021) (Ages 25 to 34)
- 1st Korea - 69%
- Finland - 66
- Japan - 65
- Ireland - 63
- Luxembourg - 63
- Lithuania - 57
- Australia - 54
- Switzerland - 52
- US - 51
- OECD average - 47
※ Source : OECD, “Education at a Glance 2022”