- Home
- Investment Opportunities
- Industries
- Shipbuilding and Marine
Shipbuilding and Marine
Shipbuliding & Marine
-
Korean Shipbuilding and Marine Industries Finding Opportunities in Environmental Regulations to Take a Leap Foraward 내용닫기Korean Shipbuilding and Marine Industries Finding Opportunities in Environmental Regulations to Take a Leap ForawardThe International Maritime Organization (IMO) is strengthening environmental regulations to reduce carbon emissions in the shipping industry. The Energy Efficiency Design Index (EEDI) was introduced in 2013, requiring new ships to be more energy efficient. Since then, the scope of the regulation has been fully extended to existing ships in operation, followed by the announcement of the IMO 2020 in 2020 aimed at limiting the sulfur content of ship fuel from 3.5% to 0.5%. Recently in 2023, the Existing Ship Energy Efficiency Index (EEXI*) and Carbon Intensity Index (CII**) were introduced for existing ships for a full-scale regulation of the energy efficiency and carbon emissions of ships in operation .* EEXI (Existing Ship Energy Efficiency Index) indicates the efficiency of existing ships
** CII (Carbon Intensity Indicator) indicates the intensity of a ship's carbon emissions.Stricter environmental regulations are expected to increase the demand for eco-friendly ships, creating opportunities for Korean shipyards with strengths in producing eco-friendly, high-value-added vessels.
The Korean shipbuilding industry won 58% of high-value-added ship orders* placed in 2022.
More specifically, Korea won 70% of large LNG carrier orders, demonstrating its world-leading LNG carrier technology. Also in the eco-friendly ship market, the Korean shipbuilding industry won more than 50% of the global orders of 26.06 million CGT.
In particular, Korea won 54% of the orders for LNG-powered ships, which are the most well-known type of eco-friendly ships.* Large LNG carriers: very large crude carriers (VLCCs) that are 12,000 TEU and larger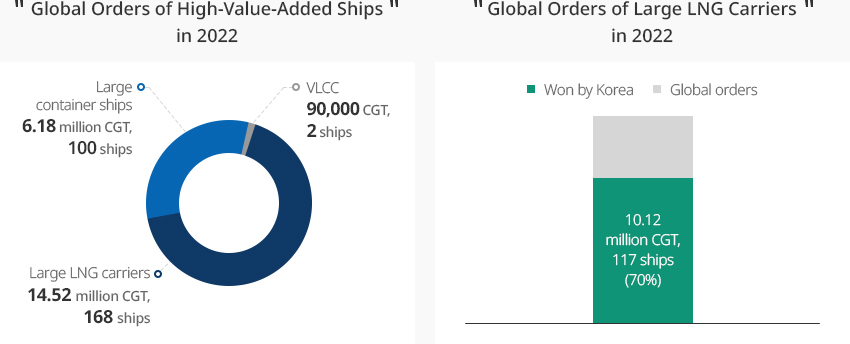
 ※ Source: Ministry of Trade, Industry and Energy (2023)
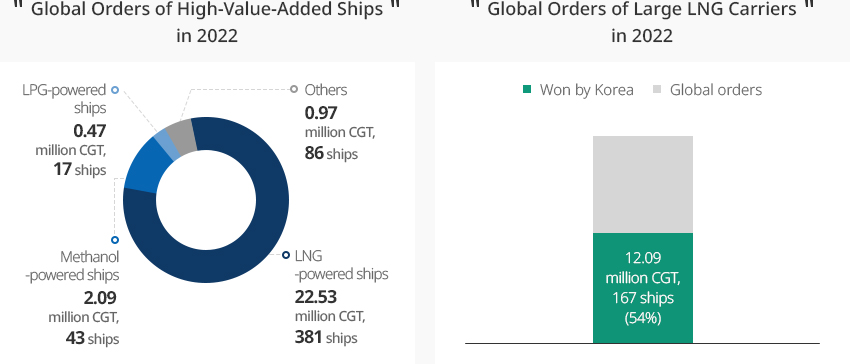 ※ Source: Ministry of Trade, Industry and Energy (2023)
 -
Korean Shipbuilding Industry Most Competitive in the World 내용열기Korean Shipbuilding Industry Most Competitive in the WorldThe Korea Institute for Industrial Economics and Trade (KIET) assessed the value chain competitiveness of the world's major shipbuilders including Korea, Japan, China, and the EU and released the Diagnosis of Competitive Advantage of the Shipbuilding Industry's Value Chain and Policy Directions (2022), which found the overall competitiveness of the Korean shipbuilding industry to be among the highest in the world (score: 86.7). Among the different categories of the value chain, Korea stands out in R&D and design, and production."Diagnosis of the World’s Major Shipbuilders and their Competitive Advantage"
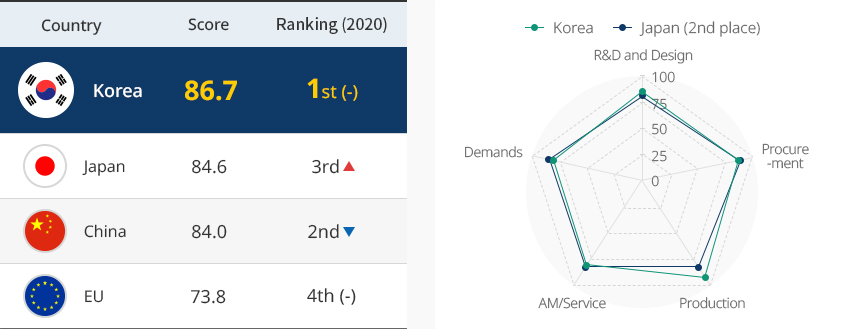 The comprehensive assessment of competitive advantage by ship type shows that Korea excels in gas carriers (LNG/LPG carriers), oil tankers, and container ships. Especially noteworthy is that Korea was found for two consecutive years to have a competitive advantage over Japan and China in high-value-added ships such as gas carriers and container ships. Korea's strength in R&D and design stems from design flexibility, which comes from the experience of having built various ship types, and its large-scale shipbuilding facilities and system infrastructure enabling economies of scale guarantee Korea's excellence in production."Comprehensive Assessment of Competitive Advantage by Ship Type"
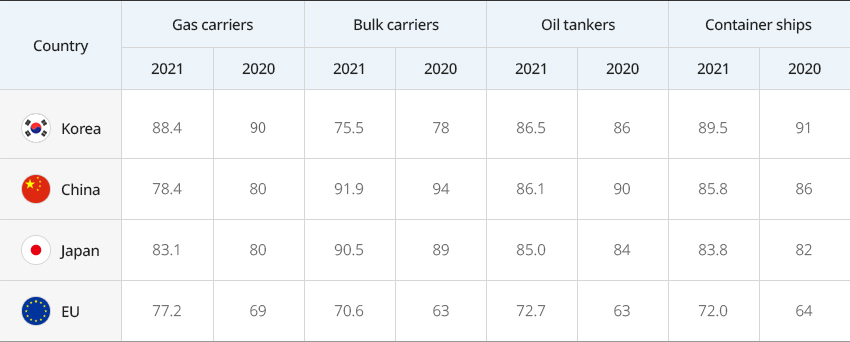
선종별 경쟁우위 종합평가 결과 표로 국가 가스운반선, 벌크선, 유조선, 컨테이너선 정보 제공 국가 가스운반선 벌크선 유조선 컨테이너선 2021 2020 2021 2020 2021 2020 2021 2020 한국 88.4 90 75.5 78 86.5 86 89.5 91 중국 78.4 80 91.9 94 86.1 90 85.8 86 일본 83.1 80 90.5 89 85.0 84 83.8 82 EU 77.2 69 70.6 63 72.7 63 72.0 64
※ Source: KIET (2022)
※ Note
1) Composite scores of each industry, country, and product are calculated on a scale of 100 by applying the importance of competitive advantage factors, value chain, and product as weights
2) (100 points) World-class level, (90 points) 97~99% of world-class level, (80 points) 94~96%, (70 points) 91~93%, (60 points) 86~90%. -
Korean Shipyards Selectively Winning Shipbuilding Orders for High-Value-Added Ships 내용열기Korean Shipyards Selectively Winning Shipbuilding Orders for High-Value-Added ShipsThe Korean shipbuilding industry has consistently won more than 30% of the world's ship orders since 2018, ranking second only to China in terms of received orders. According to Clarkson Research, the country's major shipbuilders - Hyundai Heavy Industries (including Hyundai Mipo and Hyundai Samho), Samsung Heavy Industries, and Daewoo Shipbuilding & Marine Engineering - are in top three places on the order backlog ranking, having secured an average of three to four years' worth of work.Korean shipbuilders have the largest backlog of orders since 2011, with 38.21 million CGT as of May 6, 2023. A close look at ship types show that LNG carriers, the best-known type of high-value-added vessels, account for 55%, while container ships, LPG carriers, and tankers also remain competitive with sufficient backlog. In addition, 74% of Korea's backlog is composed of ships powered by alternative fuels, indicating that orders are centered on eco-friendly ships."Global Shipbuilding Orders and Korea’s Market Share"(Unit: 10,000 CGT)
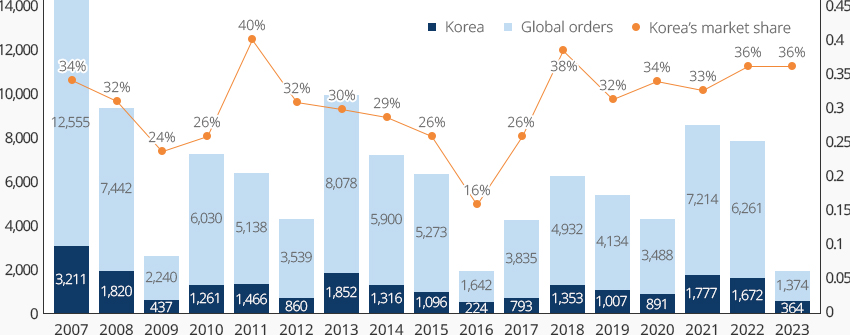 ※ Source: Clarkson Research (on May 6, 2023)
※ Note: Cumulative orders from January to April were used for 2023"Order Backlog of Korea’s Major Shipbuilders"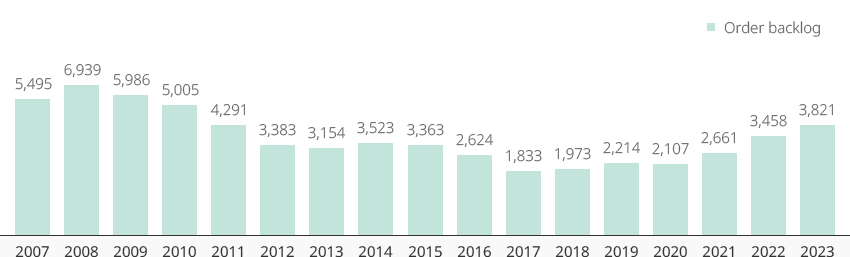 ※ Source: Clarkson Research (on May 6, 2023)
※ Note: Cumulative orders from January to April were used for 2023"Breakdown of Orders Received by Korean Shipbuilders by Ship Type"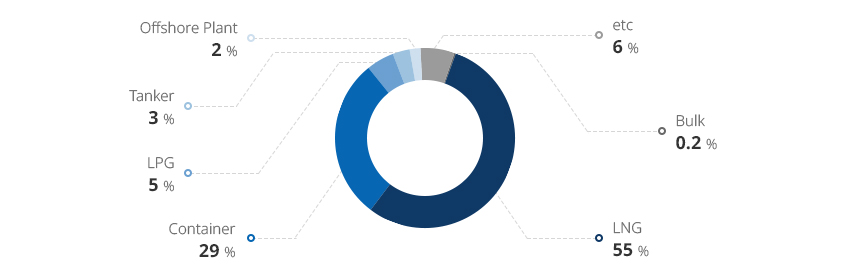 ※ Source: Clarkson Research (on May 6, 2023)
※ Note: Cumulative orders from January to April were used for 2023The Korean shipbuilding industry hopes to turn profitable by selectively taking orders. In 2021 and 2022, the Korean shipbuilding industry won large orders, but sales and operating income were relatively weak. The discrepancy stems from the fact that ship orders require a long period of time for fulfillment, and it takes two years for an order to be reflected in operating results. Considering that major Korean shipbuilders have built an order portfolio centered on high-value-added ships during the rising ship prices in 2021, they are expected to see their profitability improve and turn around in 2023."Operating Results of Korea’s Three Major Shipbuilders"조선3사 영업실적 현황 표로 구분, 년도 정보제공 Category ‘20 ‘21 ‘22 Three major shipbuilders(Korea Shipbuilding & Offshore Engineering, Samsung Heavy Industries and Daewoo Shipbuilding & Marine Engineering) Sales (USD million) 24,402 23,233 21,755 Operating Profit (USD million) -701 -3,888 -2,185 ※ Source: Financial statement of the three major shipbuilders (2023) -
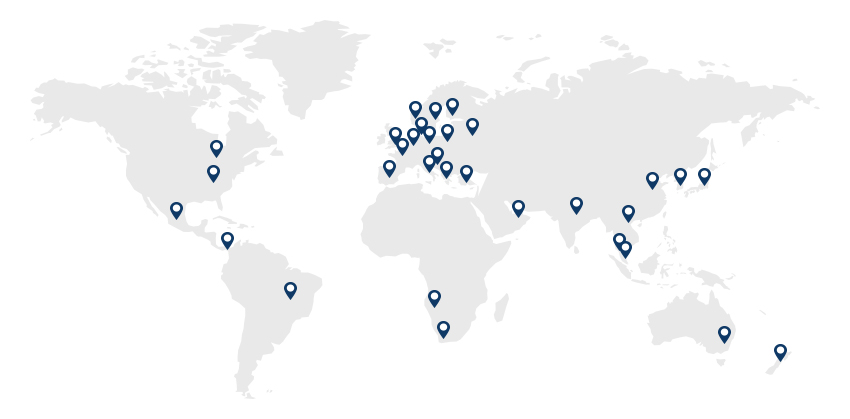
Investment Success Story : A Global High-tech Systems Supplier 내용열기Investment Success Story : A Global High-tech Systems SupplierKongsberg Maritime Korea Ltd. is a subsidiary of Kongsberg, a Norwegian company that supplies automation equipment for ship operation with leading marine technology and ship automation technology. After opening a Korean office in 1999, the company established a factory in Mieum, Busan in 2007 and employs 236 people. Kongsberg Maritime Korea supplies ship equipment such as ship automation systems, automatic positioning systems, navigation systems, and ship propulsion systems to major shipbuilders in Korea and is recognized as one of the nation's best ship automation systems suppliers. The company is currently headquartered in Busan with offices in Geoje, Ulsan, and Mokpo."Kongsberg’s Global Network"
 "Growth of Kongsberg Maritime Korea"
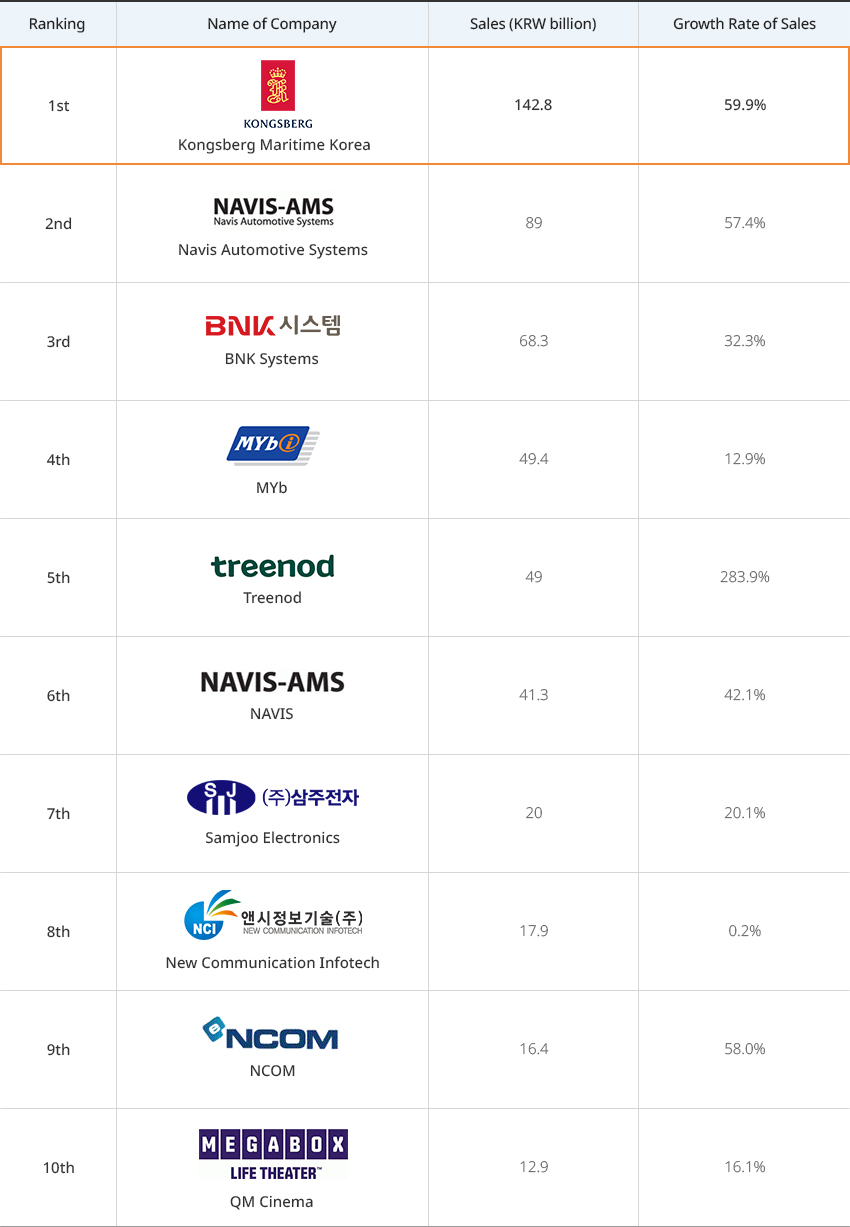
한국콩스버그마리타임(주) 성장세 표로 순위, 기업명, 매출액(억 원), 매출액 증가율 정보 제공 순위 기업명 매출액(억 원) 매출액 증가율 1위 한국콩스버그마리타임(주) 1,428 59.9% 2위 나비스오토모티브시스템즈(주) 890 57.4% 3위 (주)비엔케이시스템 683 32.3% 4위 (주)마이비 494 12.9% 5위 트리노드(주) 490 283.9% 6위 나비스(주) 413 42.1% 7위 (주)삼주 200 20.1% 8위 앤시정보기술(주) 179 0.2% 9위 엔컴(주) 164 58.0% 10위 (주)큐엠시네마 129 16.1%
-
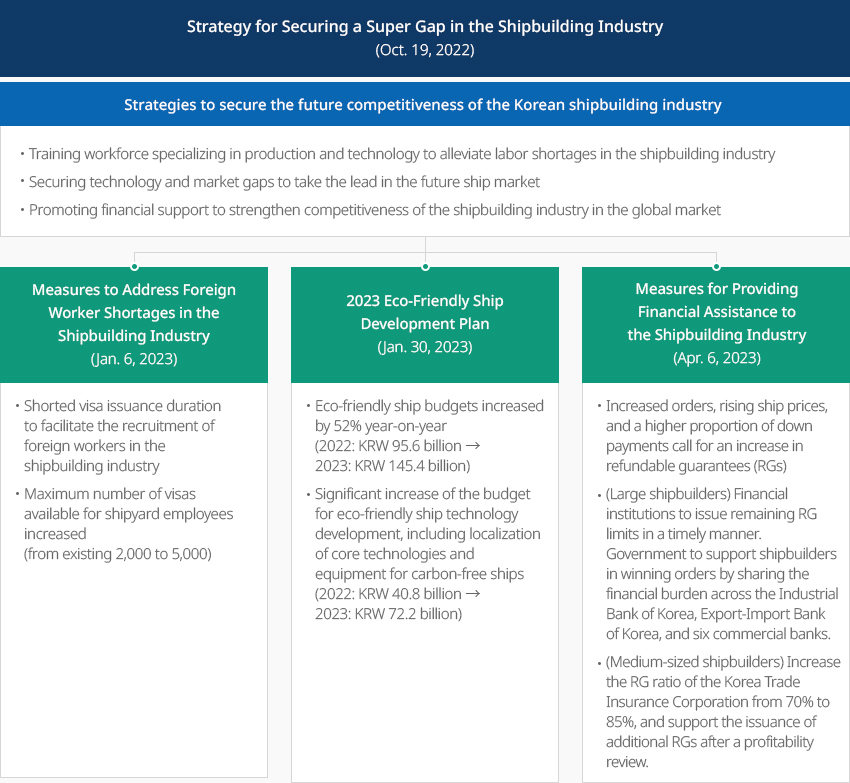
Government Strategy to Secure a Super Gap in Shipbuilding Industry 내용열기Government Strategy to Secure a Super Gap in Shipbuilding IndustryThe Korean shipbuilding industry is seeking opportunities to rebound after a prolonged recession. To assist the effort, the government announced the Strategy for Securing a Super Gap in the Shipbuilding Industry to maintain competitive in the future shipbuilding market. It has also announced a series of detailed implementation plans to add workforce, develop technology, and boost exports."Korean Government’s Recent Policies Supporting the Shipbuilding Industry"
-
Shipbuilding and Marine Engineering Clusters Centered Around Anchor Companies 내용열기Shipbuilding and Marine Engineering Clusters Centered Around Anchor CompaniesKorea's shipbuilding and marine engineering industry is mostly concentrated in the nation's southeast and southwest regions and some in the capital area. In particular, the southeast region with Busan, Ulsan, Changwon, and Geoje plays an important role as a shipbuilding cluster with many medium and large shipyards. The area stands out with a relatively high proportion of large shipyards and related companies such as Hyundai Heavy Industries, Daewoo Shipbuilding & Marine Engineering, and Hyundai Mipo Shipbuilding, while the number of small businesses is low compared to other regions.The southwest region with Mokpo and Yeongam (Jeonnam) is led by Hyundai Samho Heavy Industries, a major shipbuilding, and has numerous small and medium-sized shipbuilders and shipbuilding equipment makers. The Mokpo, Yeongam, and Haenam regions, where medium and large shipbuilders such as Hyundai Samho Heavy Industries and Daehan Shipbuilding are operating, account for 71. 5% of all shipbuilders in Jeonnam.Major Shipbuilding Industrial Complexes and Characteristics
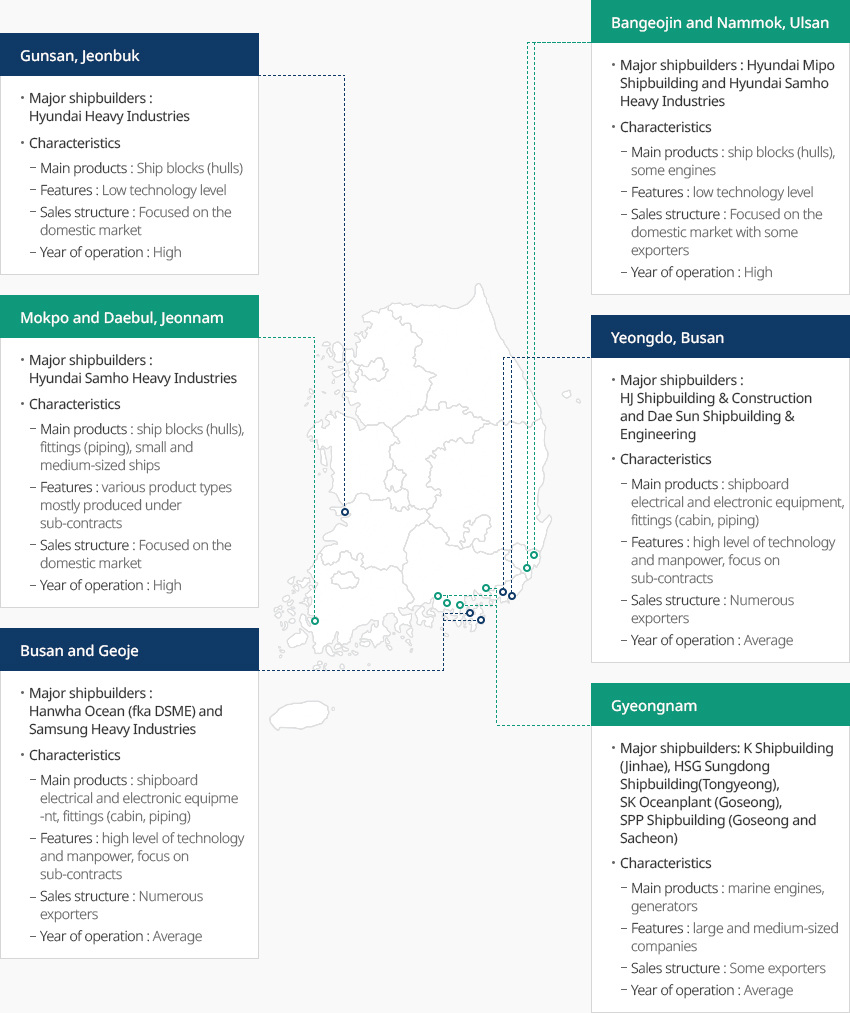
- 전라북도 군산
- 주요 중대형 조선소 : 현대중공업
- 산업단지 특징
- 주력 생산품 : 선박블록(선체)
- 특성 : 낮은 기술수준
- 해외수출 : 내수위주
- 조선업계 전속률 : 높음
- 울산 방어진,남목
- 주요 중대형 조선소 : 현대미포조선, 현대삼호중공업
- 산업단지 특징
- 주력 생산품 : 선박블록(선체), 엔진일부
- 특성 : 낮은 기술수준
- 해외수출 : 내수위주나 수출업체 有
- 조선업계 전속률 : 높음
- 전라남도 목포, 대불
- 주요 중대형 조선소 : 현대삼호중공업
- 산업단지 특징
- 주력 생산품 : 선박블록(선체), 의장품(배관), 중소형 선박
- 특성 : 다품종, 임가공 중심
- 해외수출 : 내수위주
- 조선업계 전속률 : 높음
- 부산 영도
- 주요 중대형 조선소 : 한진중공업, 대선조선
- 산업단지 특징
- 주력 생산품 : 선박용 전기전장, 의장품(선실, 배관)
- 특성 : 기술 및 인력수준 높음, 임가공 중심
- 해외수출 : 수출업체 多
- 조선업계 전속률 : 보통
- 부산 거제
- 주요 중대형 조선소 : 한화오션(구 대우조선해양), 삼성중공업
- 산업단지 특징
- 주력 생산품 : 선박용 전기전장, 의장품(선실, 배관)
- 특성 : 기술 및 인력수준 높음, 임가공 중심
- 해외수출 : 수출업체 多
- 조선업계 전속률 : 보통
- 경상남도
- 주요 중대형 조선소 : 케이조선(진해), HSG성동조선(통영), SK오션플랜트(고성), SPP조선(고성, 사천)
- 산업단지 특징
- 주력 생산품 : 선박용 엔진, 발전기
- 특성 : 대기업/중견기업 중심
- 해외수출 : 수출업체 有
- 조선업계 전속률 : 보통
※ Source: KIET (2023) - 전라북도 군산
Invest KOREA
Shipbuilding/Marine PM
Lee Chulsoon
Key Industries Promotion Team
T.+82-2-3460-7724 E.chulsoon_lee@kotra.or.kr
Recommendation on Locations
Industrial complex information
[Gyeongsangnam-do Geoje City] Hannae Shipbuilding Specialized Agricultural
Industrial Complex
Click [Go to Detailed Information] to go to the relevant information screen of
Smart K-Factory service of Industrial Complex Corporation.
-
Complex nameHannae Shipbuilding Specialized Agricultural Industrial Complex
-
Initial designation date2007.08.13
-
Designated area(m2)277,868
-
ManagementGyeongsangnam-do Geoje City
-
Nearby RailwayBusan Station
-
Distance from station(km)59
-
Nearby AirportGimhae International Airport
-
Distance from airport(km)57
-
Industrial water Supply capacity(ton/day)-
-
Affiliation local governmentGyeongsangnam-do Geoje City
-
Population246,402
Industrial complex information
[Gyeongsangnam-do Tongyeong City] Anjeong National Industrial
Complex
Click [Go to Detailed Information] to go to the relevant information screen of
Smart K-Factory service of Industrial Complex Corporation.
-
Complex nameAnjeong National Industrial Complex
-
Initial designation date1974.04.01
-
Designated area(m2)3,866,224
-
ManagementKorea Industrial Complex Corporation
-
Nearby RailwayJinju Station
-
Distance from station(km)46
-
Nearby AirportSacheon Airport
-
Distance from airport(km)45
-
Industrial water Supply capacity(ton/day)6500(㎥/day)
-
Affiliation local governmentGyeongsangnam-do Tongyeong City
-
Population129,226
Industrial complex information
[Jeollanam-do Mokpo City] Daeyang General Industrial Complex
Click [Go to Detailed Information] to go to the relevant information screen of
Smart K-Factory service of Industrial Complex Corporation.
-
Complex nameDaeyang General Industrial Complex
-
Initial designation date2009.02.05
-
Designated area(m2)1,545,007
-
ManagementJeollanam-do Mokpo City
-
Nearby RailwayMokpo Station
-
Distance from station(km)6
-
Nearby AirportMuan International Airport
-
Distance from airport(km)34
-
Industrial water Supply capacity(ton/day)5,138(㎥/day)
-
Affiliation local governmentJeollanam-do Mokpo City
-
Population226,875
Industrial complex information
[Gyeongsangnam-do Changwon City] Jinbuk Agricultural Industrial
Complex
Click [Go to Detailed Information] to go to the relevant information screen of
Smart K-Factory service of Industrial Complex Corporation.
-
Complex nameJinbuk Agricultural Industrial Complex
-
Initial designation date1989.12.15
-
Designated area(m2)133,170
-
ManagementGyeongsangnam-do Changwon City
-
Nearby RailwayMasan Station
-
Distance from station(km)22
-
Nearby AirportSacheon Airport
-
Distance from airport(km)51
-
Industrial water Supply capacity(ton/day)330(㎥/day)
-
Affiliation local governmentGyeongsangnam-do Changwon City
-
Population1,038,677
Industrial complex information
[Jeollanam-do Suncheon City] Haeryong Industrial Complex (Gwangyang Bay Area
Free Economic Zone)
Click [Go to Detailed Information] to go to the relevant information screen of
Smart K-Factory service of Industrial Complex Corporation.
-
Complex nameHaeryong Industrial Complex (Gwangyang Bay Area Free Economic Zone)
-
Initial designation date1998.04.22
-
Designated area(m2)1,592,808
-
ManagementJeollanam-do Suncheon City, Gwangyang bay area Free Economic Zone Authority
-
Nearby RailwayYulchon Station
-
Distance from station(km)5
-
Nearby AirportYeosu Airport
-
Distance from airport(km)11
-
Industrial water Supply capacity(ton/day)4,614(㎥/day)
-
Affiliation local governmentJeollanam-do Suncheon City
-
Population281,999
Industrial complex information
[Gyeongsangnam-do Geoje City] Obi 2nd General Industrial Complex
Click [Go to Detailed Information] to go to the relevant information screen of
Smart K-Factory service of Industrial Complex Corporation.
-
Complex nameObi 2nd General Industrial Complex
-
Initial designation date2014.09.05
-
Designated area(m2)108,613
-
ManagementGyeongsangnam-do Geoje City
-
Nearby RailwayJinhae Station
-
Distance from station(km)65
-
Nearby AirportGimhae International Airport
-
Distance from airport(km)63
-
Industrial water Supply capacity(ton/day)64(㎥/day)
-
Affiliation local governmentGyeongsangnam-do Geoje City
-
Population246,402