- Home
- Investment Opportunities
- Industries
- Logistics
Logistics
Logistics
-
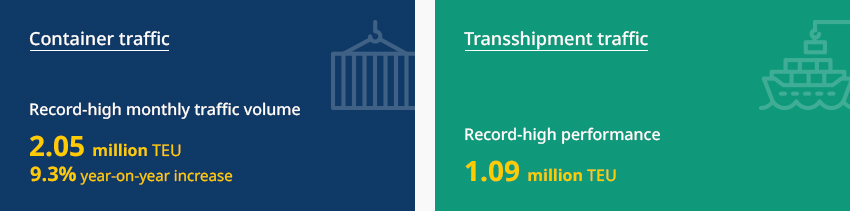
Korea’s Logistics Industry Trends and Outlook CloseKorea’s Logistics Industry Trends and OutlookLeveraging Logistics Hubs: Logistics Companies Continue Growing Backed by the Recovery of Busan and Incheon's Port Traffic1)In March 2023, the monthly container traffic volume at Busan Port reached a record high of 2.05 million TEUs. This represents a 9.3% year-on-year increase (the previous record was 2.02 million TEUs). Despite the prolonged global crises such as the endemic and Russia's invasion of Ukraine, Busan Port achieved best-ever results in transshipment cargo (T/S Cargo) traffic (approximately 1.09 million TEU), which is one of the port’s main strengths. A close look at the transshipment volume in March shows that the transshipment volume of Maersk, which uses Busan Port for transshipment, increased by about 53% (about 80,000 TEU)."Traffic Volume of Busan Port"
 In February 2023, air cargo traffic at Incheon International Airport decreased by 13% year-on-year. However, demand is expected to increase again in Q3 considering the twelve consecutive months of declining air cargo demand due to the global economic slowdown and the exhaustion of pandemic-specific cargo. In December 2022, Atlas Airlines, the world's largest international cargo airline, announced plans to develop a dedicated aircraft maintenance, repair and overhaul (MRO) facility at Incheon International Airport. The company’s business in Korea is expected to continue growing by expanding its aircraft maintenance business to include cargo and passenger airlines in operation.In 2022, Korea's major second-party logistics providers (2PLs) grew both in size and profit on the back of favorable marine freight rates and traffic growth. In 2022, the average operating margin of Korea's top five 2PLs was 3.3%, up 0.7 percentage points from the previous year. They are preparing to grow into global players as they are expected to introduce AI technology to their logistics centers.※ 1) National Logistics Information CenterTraffic Volume Expected to Grow in Most Areas of Import and Export Containers, Shipment of Daily Goods, and General CargoSimilarly with Busan Port, container traffic volume at Incheon Port increased by 20% year-on-year to 298,933 TEUs, which is the highest traffic volume ever for the month of March. Factors contributing to the increase include ▲ strong imports and exports from China, Thailand, and Vietnam due to the longer stopovers of container ships ▲ an increase in the recovery of empty containers for loading automotive parts ▲ and an increase in the repositioning of empty containers to China. 1)In 2023, the logistics industry will inevitably be affected by the global economic slowdown caused by the war in Ukraine, inflation, and high interest rates. However, the overall traffic volume is expected to increase, boosted by the transformation of digital logistics and the expansion of platform businesses, and Korea's import and export container traffic volume is expected to grow by 4.2% year-on-year, and shipment of daily goods is expected to increase by 10.9%. 2)"Growth Outlook of Import/Export Traffic"
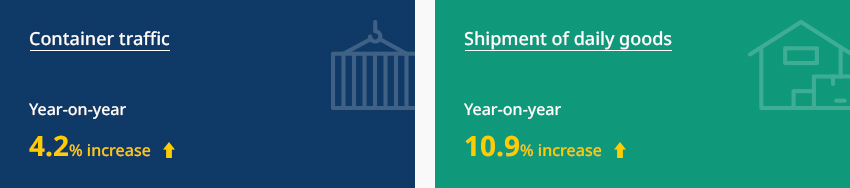 ※ 1) The Logistics Magazine
2) 2023 Seminar on Outlook of Transportation, Logistics, and Aviation Industries, Korea Transport Institute, November 18, 2022Logistics Centers Developing in Two Directions (Mega-Sized Regional Bases vs. Small-Sized Urban Bases)With the increase of transportation volume and the introduction of low-volume and multi-product processing facilities, shippers are becoming larger, more advanced, and concentrated through M&A. Recently-built logistics centers are actively leveraging AI-based robot systems (e.g., China's Geek+) for increased safety, efficiency and accuracy.At the same time, the explosive growth of the quick commerce market triggered by COVID-19 resulted in the growing number of small-sized warehouses in urban areas. In addition, more urban logistics centers* are being introduced by reducing the size of existing large-sized stores (dark stores, MFCs, PPCs, etc.) 1)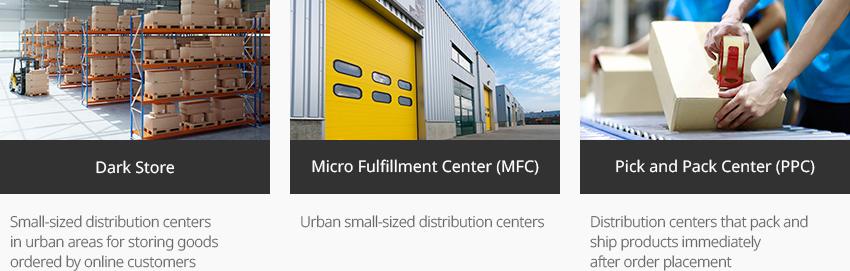 ※ 1) Distribution Centers – Why are They Coming Back to Cities? (2022) Korea Logistics NewsCold Chain to Continue Growing at an Annual Average Rate of 15%Based on the forecasts of various research organizations, the global cold chain market is expected to double in size from about USD 224 billion in 2020 to USD 438 billion in 2026, growing at an average annual rate of about 15%.In Korea, the cold chain sector was estimated to be worth KRW 49 trillion in 2018, compared to the logistics industry's KRW 120 trillion. By 2028, the cold chain sector will catch up with the logistics industry by reaching KRW 195 trillion and surpass it afterwards."Growth Outlook of the Global Cold Chain"
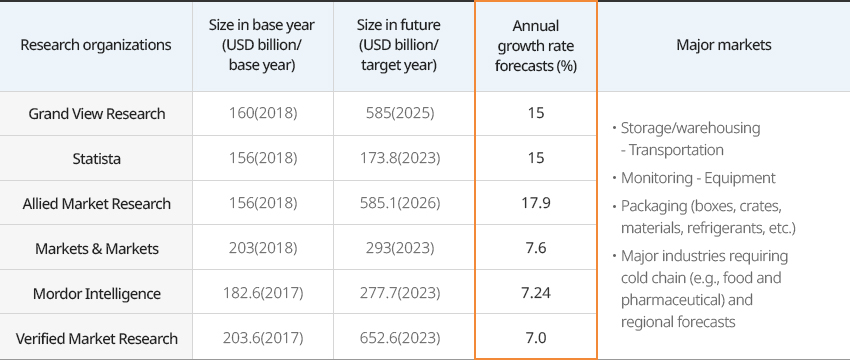
Growth Outlook of the Global Cold Chain Research organizations, Size in base year (USD billion/base year), Size in future (USD billion/target year), Annual growth rate forecasts (%), Major markets Research organizations Size in base year (USD billion/base year) Size in future (USD billion/target year) Annual growth rate forecasts (%) Major markets Grand View Research 1,600(2018) 5,850(2025) 15 - Storage/warehousing - Transportation
- Monitoring - Equipment
- Packaging (boxes, crates, materials, refrigerants, etc.)
- Major industries requiring cold chain (e.g., food and pharmaceutical) and regional forecasts
Statista 1,560(2018) 1,738(2023) 15 Allied Market Research 1,560(2018) 5,851(2026) 17.9 Markets & Markets 2,030(2018) 2,930(2023) 7.6 Mordor Intelligence 1,826(2017) 2,777(2023) 7.24 Verified Market Research 2,036(2017) 6,526(2023) 7.0
※ Source: Today Energy (2021) -
Why Korea Appeals to Investors OpenWhy Korea Appeals to InvestorsIncheon Airport and Busan Port Serve as Mega Hubs Creating a Dense Trilateral Feeder Network Covering Korea, China and JapanWith Busan Port, the world's second largest transshipment port 1) and Incheon Airport, the world's second largest air cargo hub 2), Korea offers fast turnaround times and low costs for importing and exporting 3), making it easy for businesses to trade. The ports are located at the center of mega-markets of Japan and China, which make them excellent logistics hubs. Busan Port is a world-class terminal operator with a skilled workforce and is currently home to global terminal operators (GTOs) such as PSA, DP World, and Hutchinson.
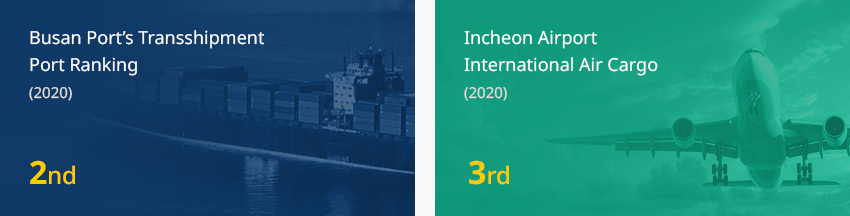 1) Drewry "Container Forecaster & Annual Review 2020/21“, Busan Port Authority.
”2020 Busan Port Container Cargo Processing and Shipment Statistics“ Global ranking of transshipment ports: Busan ranked No. 2 in 2018 and 2019
2) Airport Council International (ACI)(2020), Incheon International Airport Corporation,
“Incheon Airport Enjoys Best Ever Q1 in International Cargo Volume" Press release, world's No. 3 in 2020
3) The World Bank Group, “Doing Business 2020” (searched on November 2, 2021)
(https://www.doingbusiness.org/en/reports/global-reports/doing-business-2020)"Busan Port Traffic Trends and Outlook for 2023 (2021-2023)"(Unit: thousand TEUs, %)Busan Port Traffic Trends and Outlook for 2023 (2021-2023) Category, Year Category 2021 2022 2023 (Forecast) Traffic volume YoY Change(YoY) Traffic volume YoY Change(YoY) Traffic volume Change in volume YoY Change(YoY) Total 22,706 4.0 22,110 △ 2.6 22,312 202 0.9 Import/Export 10,433 6.4 10,310 △ 1.2 10,382 72 0.7 Export 5,225 5.5 5,200 △ 0.7 5,313 113 2.2 Import 5,208 7.3 5,110 △ 1.7 5,069 △ 41 △ 0.8 Transshipment(T/S) 12,273 2.1 11,800 △ 3.9 11,930 130 1.1 ※ Source: Busan Port Authority (2022)Another advantage of Busan Port is that it can function as a global logistics hub in connection with the markets of Europe and North America. (European route (Rotterdam 19,866 km/429 hr), North American route (LA 9,892 km/214 hr)) Busan Port serving as Korea's logistics gateway is expected to record about 22.31 million TEUs of traffic in 2023, an increase of about 0.9% from the previous year. Import and export traffic is expected to grow by 0.7% to 10.38 million TEUs, and transshipment cargo, the port's biggest strength, is expected to increase by 1.1% to 11.93 million TEUs.Busan Port can operate year-around and is safe from natural disasters such as typhoons and fog. Considering that major ports in China are closed for an average of 22 days each year in 2021 (Shanghai 22 days, Ningbo 32 days, and Qingdao 28 days), Busan Port's 24/7 operation can serve as a great strength. Moreover, Busan Port’s deep water depth (16-17 meters) allows the berthing of even the world's largest container ships.Efficient Logistics Processing Based on Expedited Shipping and Receiving"Time and Cost for Import and Export"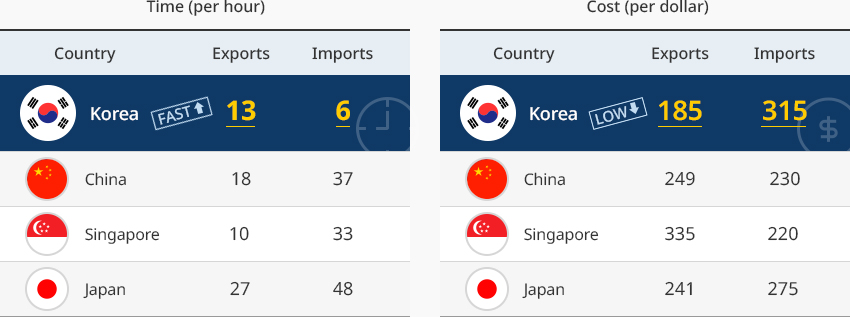 소요시간 (시간당)
Time and Cost for Import and Export 국가, 수출, 수입 정보 제공 국가 수출 수입 한국 13 6 중국 18 37 싱가포르 10 33 일본 27 48 소요비용 (달러당)국가별 수출입 소요비용 표로 국가, 수출, 수입 정보 제공 국가 수출 수입 한국 185 315 중국 249 230 싱가포르 335 220 일본 241 275
※ Source: Korea Customs Service, Korea International Trade Association, Japanese Ministry of Economy, Trade and Industry, and China Customs (2021)Steady Growth in Logistics InfrastructureBefore the 2000s, the Korean logistics industry grew rapidly in size backed by the rapid economic growth and export-oriented economic structure. Since the 2000s, it has also grown in quality thanks to the rise of the Chinese market and the government's investment in logistics infrastructure (Incheon Airport, Busan New Port, inland logistics bases, etc.). Due to the narrow land space and being disconnected from the Asian continent blocked by North Korea, domestic cargo is mostly handled by trucks while international cargo is handled by ports and airports. Surrounded by sea on three sides and located between China and Japan, Korea has an export-oriented economy which helped the development of international logistics industry centered the capital region (Incheon Port and Incheon Airport) and the Busan region (Busan Port). The logistics belt connecting Seoul and Busan is filled with logistics infrastructure encompassing transportation networks, airports, ports, and inland logistics bases."Major Indexes of Transport and Logistics Industries"Major Indexes of Transport and Logistics Industries Category, Transport Industry, Logistics Industry Category Transport Industry Logistics Industry 2020 2021 2020 2021 Change Rate of change(%) Change Rate of change(%) No. of companies 552,075 575,407 23,332 4.2 375,116 398,796 23,680 6.3 No. of employees 1,256,162 1,312,222 56,060 4.5 714,336 783,591 69,255 9.7 Sales (KRW billion) 151,537 193,288 41,751 27.6 112,195 154,803 42,608 38.0 Operating expenses (KRW billion) 142,663 168,214 25,551 17.9 100,470 127,495 27,026 26.9 ※ Source: Statistics Korea, press release; 2021 Transport Industry Survey (provisional) (including logistics industry statistics), December 9, 2022"Korea’s Logistics Industry"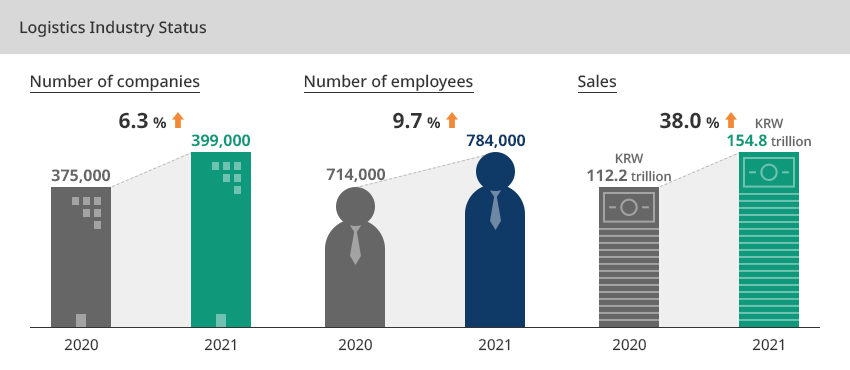
 Sales by Industry and Sales Ratio
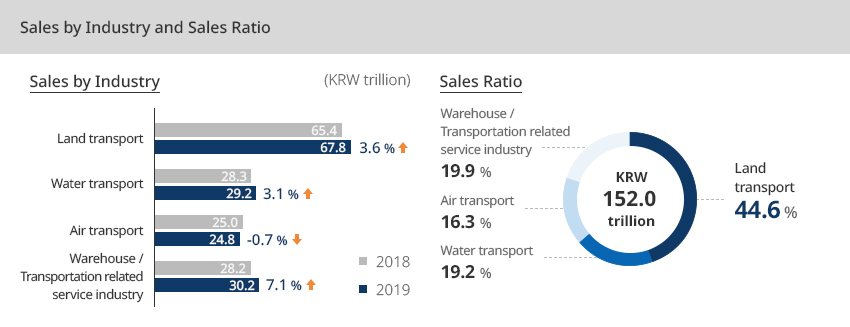
- 업종별 매출액 (단위 : 조원)
- 육상운송업 3.6% 증가 - 2018년 65.4%, 2019년 67.8%
- 수상운송업 3.1% 증가 - 2018년 28.3%, 2019년 29.2%
- 항공운송업 -0.7% 하락 - 2018년 25.0%, 2019년 24.8%
- 창고·운송관련 서비스업 7.1% 증가 - 2018년 28.2%, 2019년 30.2%
- 매출액 구성비 - 152.0조원
- 육상운송업 44.6 %
- 창고·운송관련 서비스업 19.9 %
- 수상운송업 19.2 %
- 항공운송업 16.3 %
※ Source: Statistics Korea, press release; 2021 Transport Industry Survey (provisional) (including logistics industry statistics), December 9, 2022Foreign Investment in Various Types of Logistics Businesses in KoreaAs of 2020, Korea's FDI in the logistics and distribution industry amounted to USD 1.831 billion, with a 38.7% year-on-year increase in FDI in transportation and warehousing (logistics). Greenfield investment accounted for 92%, with companies from various countries such as Hong Kong, the United States, China, Singapore, Germany, and the United Arab Emirates entering the Korean market.As of 2020, Korea's FDI in the logistics industry (transportation and warehousing) totaled USD 632 million in 44 projects, with the country attracting a total of USD 3,154 million over the past seven years. The size of investment appears to be fluctuating considering that FDI is significantly influenced by the investment climate (policies, facilities, market size, etc.) of neighboring competitors as well as by the domestic economy.In the past, the industry merely attracted USD 66-143 million from 2011 to 2013, whereas in the last seven years, the amount increased significantly to USD 300~600 million and is stabilizing at these level. The size of investment (in terms of declared amount) was 17% for M&A type investment, while the absolute majority or 83% was greenfield type. - 업종별 매출액 (단위 : 조원)
-
Government Policies OpenGovernment PoliciesOverview of National Logistics Master PlanSince the establishment of the 1st Master Plan (5 years) in 2000, the government has formulated and implemented logistics policies four times.The 5th Master Plan (announced in July 2021) is a ten-year plan with more comprehensive and detailed strategies (six strategies, ten key initiatives, and 19 detailed tasks)"Summary of the National Logistics Master Plan"
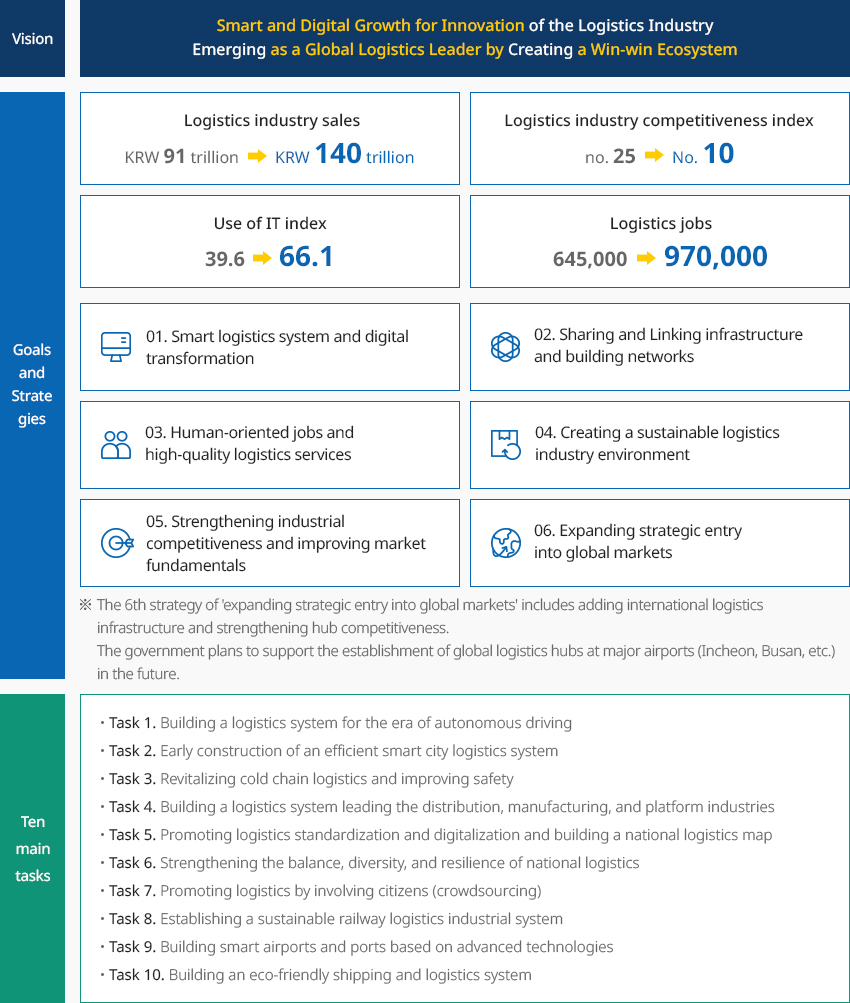
- Vision - Smart and Digital Growth for Innovation of the Logistics Industry Emerging as a Global Logistics Leader by Creating a Win-win Ecosystem
- Goals and Strategies
- Logistics industry sales KRW 91 trillion -> KRW 140 trillion
- Logistics industry competitiveness index No. 25 -> No. 10
- Use of IT index 39.6 -> 66.1
- Logistics jobs 645,000 -> 970,000
- 01.Smart logistics system and digital transformation
- 02.Sharing and Linking infrastructure and building networks
- 03.Human-oriented jobs and high-quality logistics services
- 04.Creating a sustainable logistics industry environment
- 05.Strengthening industrial competitiveness and improving market fundamentals
- 06.Expanding strategic entry into global markets
- Ten main tasks
- Task 1. Building a logistics system for the era of autonomous driving
- Task 2. Early construction of an efficient smart city logistics system
- Task 3. Revitalizing cold chain logistics and improving safety
- Task 4. Building a logistics system leading the distribution, manufacturing, and platform industries
- Task 5. Promoting logistics standardization and digitalization and building a national logistics map
- Task 6. Strengthening the balance, diversity, and resilience of national logistics
- Task 7. Promoting logistics by involving citizens (crowdsourcing)
- Task 8. Establishing a sustainable railway logistics industrial system
- Task 9. Building smart airports and ports based on advanced technologies
- Task 10. Building an eco-friendly shipping and logistics system
-
Industrial Clusters CloseIndustrial ClustersKorea's logistics system has seven inland logistics bases and multi-purpose logistics terminals in five regions (Seoul, Busan, central region, Honam, and Yeongnam). A total of thirty industrial complexes specializing in logistics (total area of 12 million m2) are operating nationwide. Logistics companies are mostly operating in free economic zones and free trade zones that provide benefits such as tariff suspension, tax reduction, and infrastructure provision.Starting with Incheon in 2003, a total of nine free zones are in operation, including Busan, Jinhae, Gwangyangman Bay, Gyeonggi, Incheon, Daegu, Gyeongbuk, Chungbuk, Gangwon, Gwangju, and Ulsan. Logistics clusters have been formed in Incheon, Busan Jinhae, and Gwangyangman Bay, which have international logistics ports.
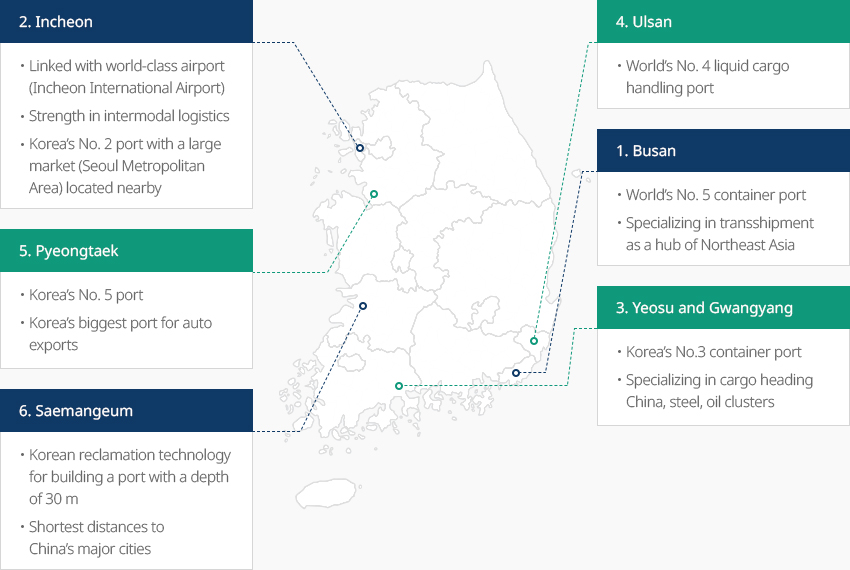
- 1. Busan
- World’s No. 5 container port
- Specializing in transshipment as a hub of Northeast Asia
- 2.Incheon
- Linked with world-class airport (Incheon International Airport)
- Strength in intermodal logistics
- Korea’s No. 2 port with a large market (Seoul Metropolitan Area) located nearby
- 3.Yeosu and Gwangyang
- Korea’s No.3 container port
- Specializing in cargo heading China, steel, oil clusters
- 4.Ulsan
- World’s No. 4 liquid cargo handling port
- 5.Pyeongtaek
- Korea’s No. 5 port
- Korea’s biggest port for auto exports
- 6.Saemangeum
- Korean reclamation technology for building a port with a depth of 30 m
- Shortest distances to China’s major cities
- 1. Busan
-
Investment Success Stories OpenInvestment Success StoriesCoupang / USSince its establishment in Korea in 2010, Coupang has invested KRW 6.2 trillion to build more than 30 logistics hubs nationwide in the past 12 years and emerged as a major investor greatly contributing to the national economy. Taking advantage of the explosive growth of the e-commerce market in Korea, Coupang has made aggressive investments and established itself as an industry leader.Over the past few years, Coupang directly employed more than 60,000 people in the domestic market, contributing to the revitalization of local commercial districts by creating large-scale employment. It is also leading the advancement of the logistics industry by introducing AI algorithms and robot automation in its state-of-the-art large-scale logistics centers (e.g. Daegu FC).EMP Belstar / USEMP Belstar is a global investor that has established cold chain clusters in major logistics hubs across Korea, including Busan, Incheon, and Pyeongtaek Ports. As its first project in Korea, EMP Bestar has built an ultra-low temperature logistics complex facility in Oseong Industrial Complex in Pyeongtaek, completed and launched in January 2019. It is also building ultra-low temperature facilities in Busan and Incheon, with a vision to establish its Asian cold chain hub in Korea.The total amount of executed and planned investment in Korea reached USD 2-3 billion, and EMP Belstar aimed to increase its market share to 25% by building five to six cold storage facilities nationwide, starting from investing in major logistics clusters.
Invest KOREA
Distribution/Logistics PM
Ghang Nam Hoon
Service Industry Promotion Team
T.+82-2-3460-3285 E.damon_ghang@kotra.or.kr
Recommendation on Locations
Industrial complex information
[Busan Metropolitan City Gangseo-gu] Busan New Port Backward International
Industrial Logistic City (Stage 1) General Industrial Complex (Busan Jinhae Free Economic
Zone)
Click [Go to Detailed Information] to go to the relevant information screen of
Smart K-Factory service of Industrial Complex Corporation.
-
Complex nameBusan New Port Backward International Industrial Logistic City (Stage 1) General Industrial Complex (Busan Jinhae Free Economic Zone)
-
Initial designation date2010.03.03
-
Designated area(m2)5,707,591
-
ManagementBusan-Jinhae Free Economic Zone Authority
-
Nearby RailwayBusan Station
-
Distance from station(km)26
-
Nearby AirportGimhae International Airport
-
Distance from airport(km)19
-
Industrial water Supply capacity(ton/day)20479(㎥/day)
-
Affiliation local governmentBusan Metropolitan City Gangseo-gu
-
Population3,401,078
Industrial complex information
[Incheon Metropolitan City Bupyeong-gu] Korea Export (Bupyeong
District)
Click [Go to Detailed Information] to go to the relevant information screen of
Smart K-Factory service of Industrial Complex Corporation.
-
Complex nameKorea Export (Bupyeong District)
-
Initial designation date1965.06.16
-
Designated area(m2)609,361
-
ManagementKorea Industrial Complex Corporation
-
Nearby RailwayBupyeong Station
-
Distance from station(km)5
-
Nearby AirportGimpo International Airport
-
Distance from airport(km)14
-
Industrial water Supply capacity(ton/day)384000(㎥/day)
-
Affiliation local governmentIncheon Metropolitan City Bupyeong-gu
-
Population2,943,491
Industrial complex information
[Incheon Metropolitan City Seo-gu, Nam-gu, Bupyeong-gu] Korea Export(Juan
District)
Click [Go to Detailed Information] to go to the relevant information screen of
Smart K-Factory service of Industrial Complex Corporation.
-
Complex nameKorea Export(Juan District)
-
Initial designation date1969.08.05
-
Designated area(m2)1,176,829
-
ManagementKorea Industrial Complex Corporation
-
Nearby RailwayBupyeong Station
-
Distance from station(km)7
-
Nearby AirportGimpo International Airport
-
Distance from airport(km)25
-
Industrial water Supply capacity(ton/day)250000(㎥/day)
-
Affiliation local governmentIncheon Metropolitan City Seo-gu, Nam-gu, Bupyeong-gu
-
Population2,943,491
Industrial complex information
[Chungcheongbuk-do Eumseong County] Oseon Industrial Complex
Click [Go to Detailed Information] to go to the relevant information screen of
Smart K-Factory service of Industrial Complex Corporation.
-
Complex nameOseon Industrial Complex
-
Initial designation date2014.04.11
-
Designated area(m2)459,481
-
ManagementChungcheongbuk-do Eumseong County
-
Nearby RailwayEumseong Station
-
Distance from station(km)19
-
Nearby AirportCheongju International Airport
-
Distance from airport(km)43
-
Industrial water Supply capacity(ton/day)871(㎥/day)
-
Affiliation local governmentChungcheongbuk-do Eumseong County
-
Population94,179
Industrial complex information
[Gyeonggi-do Uiwang City] Uiwang Techno Park
Click [Go to Detailed Information] to go to the relevant information screen of
Smart K-Factory service of Industrial Complex Corporation.
-
Complex nameUiwang Techno Park
-
Initial designation date2016.12.28
-
Designated area(m2)158,708
-
ManagementGyeonggi-do Uiwang City
-
Nearby RailwaySuwon Station
-
Distance from station(km)10
-
Nearby AirportGimpo International Airport
-
Distance from airport(km)39
-
Industrial water Supply capacity(ton/day)754(㎥/day)
-
Affiliation local governmentGyeonggi-do Uiwang City
-
Population162,751
Industrial complex information
[Gangwon-do Donghae City] Bukpyeong 2nd General Industrial Complex
Click [Go to Detailed Information] to go to the relevant information screen of
Smart K-Factory service of Industrial Complex Corporation.
-
Complex nameBukpyeong 2nd General Industrial Complex
-
Initial designation date2013.10.14
-
Designated area(m2)598,964
-
ManagementGangwon-do Donghae City
-
Nearby RailwayChuam Station
-
Distance from station(km)1
-
Nearby AirportYangyang International Airport
-
Distance from airport(km)93
-
Industrial water Supply capacity(ton/day)2,153(㎥/day)
-
Affiliation local government2,153
-
Population90,548